
Trading Opportunity Of Breakaway Gaps Low Risk High Profit The Opening Price Gaps-II
We are going to learn about the trading opportunity of breakaway gaps and how to identify them as they just start to occur. But first, let us quickly describe other types of gaps in brief.
Classification Of Price Gaps
Common Price Gap
Common gaps occur within a sideways price move. As they occur within sideways movement it reverses the price direction near the boundaries. So they don’t provide much movement for delivery traders. But it can provide some intraday move for intraday traders.


Click Here To Understand The Basics Of Price Gap And How To Trade Gaps On Intraday
Runaway Price Gap
A runaway gap occurs when the price is moving rapidly and almost at the half of the final move. So if we find a runaway gap then we can expect to move in the ongoing direction and about the same as the current move from breakout. Due to this measuring property, it is also called measuring gap.
Exhaustion Price Gap
It occurs when the trend has completed its move and about to exhaust. So it suggests a completion of the ongoing move and eventually a reversal. Now let us move to our original topic of the trading opportunity of breakaway gaps which is the forth in classification.
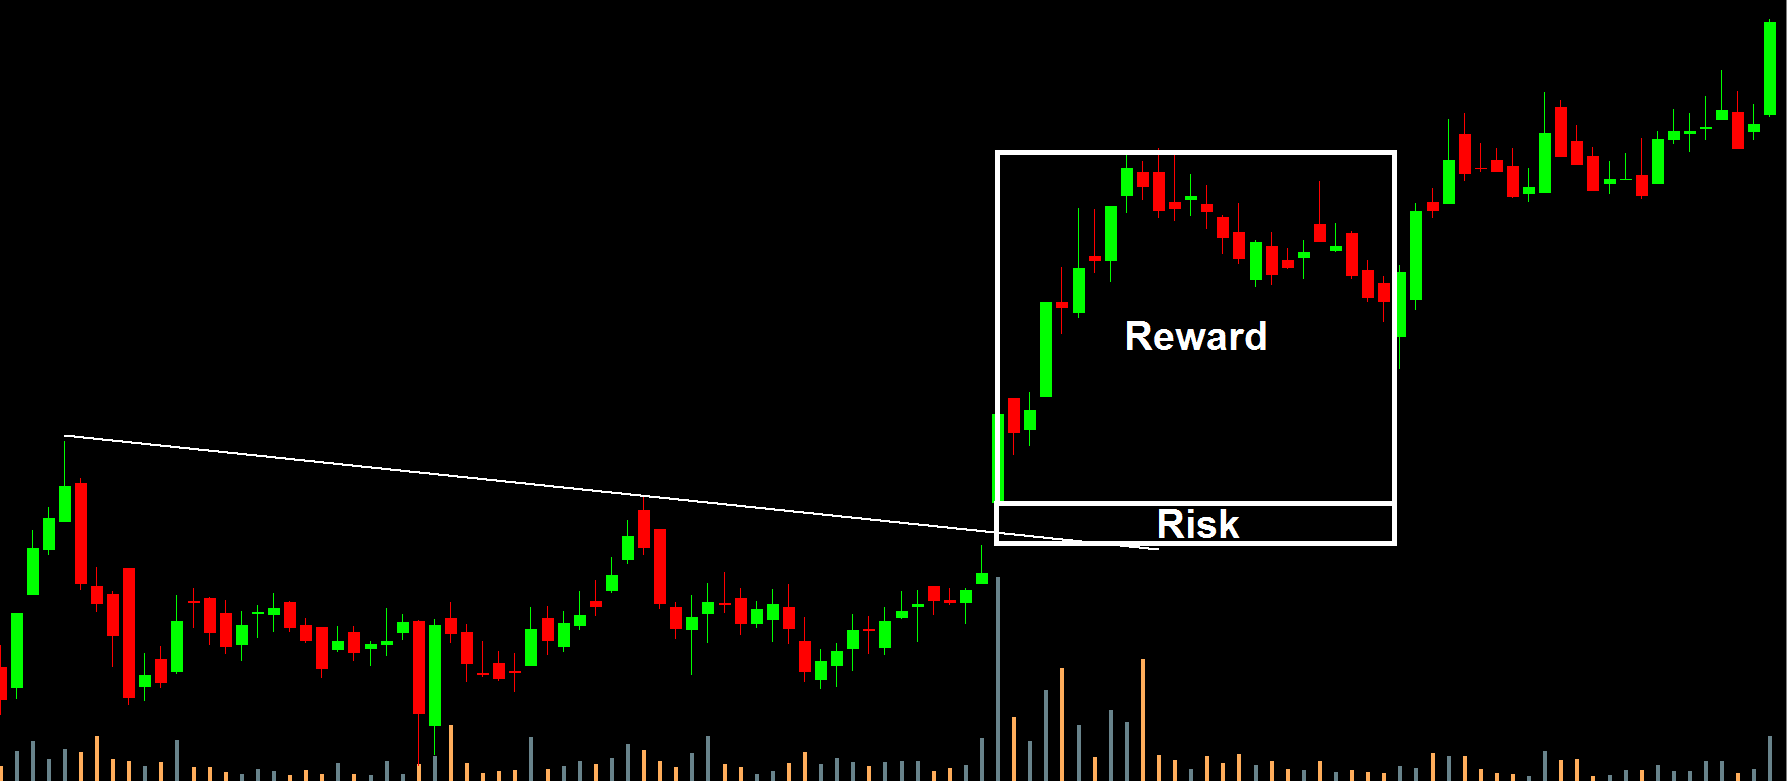
Breakaway Price Gap
A breakaway gap is also called breakout gap as it occurs during the break out of the sideways price move. It is of greater importance for swing traders, position traders and even for intraday trading. If you can accurately locate a breakout gap on any stock chart, it can earn you 10% to 50% profit in one trade only. And Even a 5-8% move in intraday trading.

How To Identify Trading Opportunity Of Breakaway Gaps?
There are the attributes of a breakaway gap that we can use to identify them just at the time when they occur. They are listed here:
- The first, there will be some clear sideways pattern before the occurrence of a breakaway gap. Prices will be moving only horizontal without any sustained move in one direction.
- As there is sideways move there must be some clearly defined upper and lower boundary for the price. This boundary lines can be parallel horizontal or conversing to each other making a triangle and in very rare case it can be diverging also. The upper line is resistance for rising price and the lower line is support for declining prices.
- On the day of a breakout from this pattern whatever it may be rectangle or triangle there will be a considerable increase in the volume of trading.
- After the breakout of pattern, there will be very good momentum in price in the direction of the breakout at the opening and during the day for some days.

You should spot the criteria for breakaway gaps listed above in these example charts and you can also find it any other chart of your favorite stock, index or commodity in any of the world’s exchange. If you are not confident of how to spot all criteria for a breakaway gap, watch the following video for details explanation of the breakaway gap in chart examples.
If you really like this post of the trading opportunity of breakaway gaps please share it on social media. Thus you will help me support to continue this works. Have you ever trades gaps? What is your experience and confusion in a gap? Share your thoughts in the comments.


vibrant wave is willing to endorse most powerful and great content always just for you.