
Is Smart Money Buying Or Selling? The BVSV Smart Money Indicator
What Is Smart Money?
Smart money is a collective term for traders who efficiently trade their capital for maximum return. It includes syndicate traders, institutions, market makers, specialists and also some individual professional traders who their own and their client’s accounts. It is implicitly considered that they buy stocks when the price is lower, favorable and also there is the availability of supply. And they sell their holdings when prices are higher and there is enough demand for the stock or market in general.
Does The Smart Money Always Make Profit?
The answer is very easy and that is simple “NO”. Because it is not possible for anyone to consistently win without losing any money in trading. But in this case, the losses are small and profits are bigger. They change their position as soon as they find themselves on the wrong side.
How To Know What The Smart Money Is Doing?
One more thing that is implicitly considered is that the smart money is trading in big lots. So the activity of smart money is recorded as a higher trading volume. But volume itself is nondirectional, it does not tell whether it is buying or selling of smart money. To know whether it is buying or selling by smart money we need to add price to the scene.
Starting with the proposition that the smart money buys when the prices are lower and sell when prices are higher. We can derive an indicator which measures buying volume and selling volume by smart money. The sum of this buying volume and selling volume is equal to total trading volume.
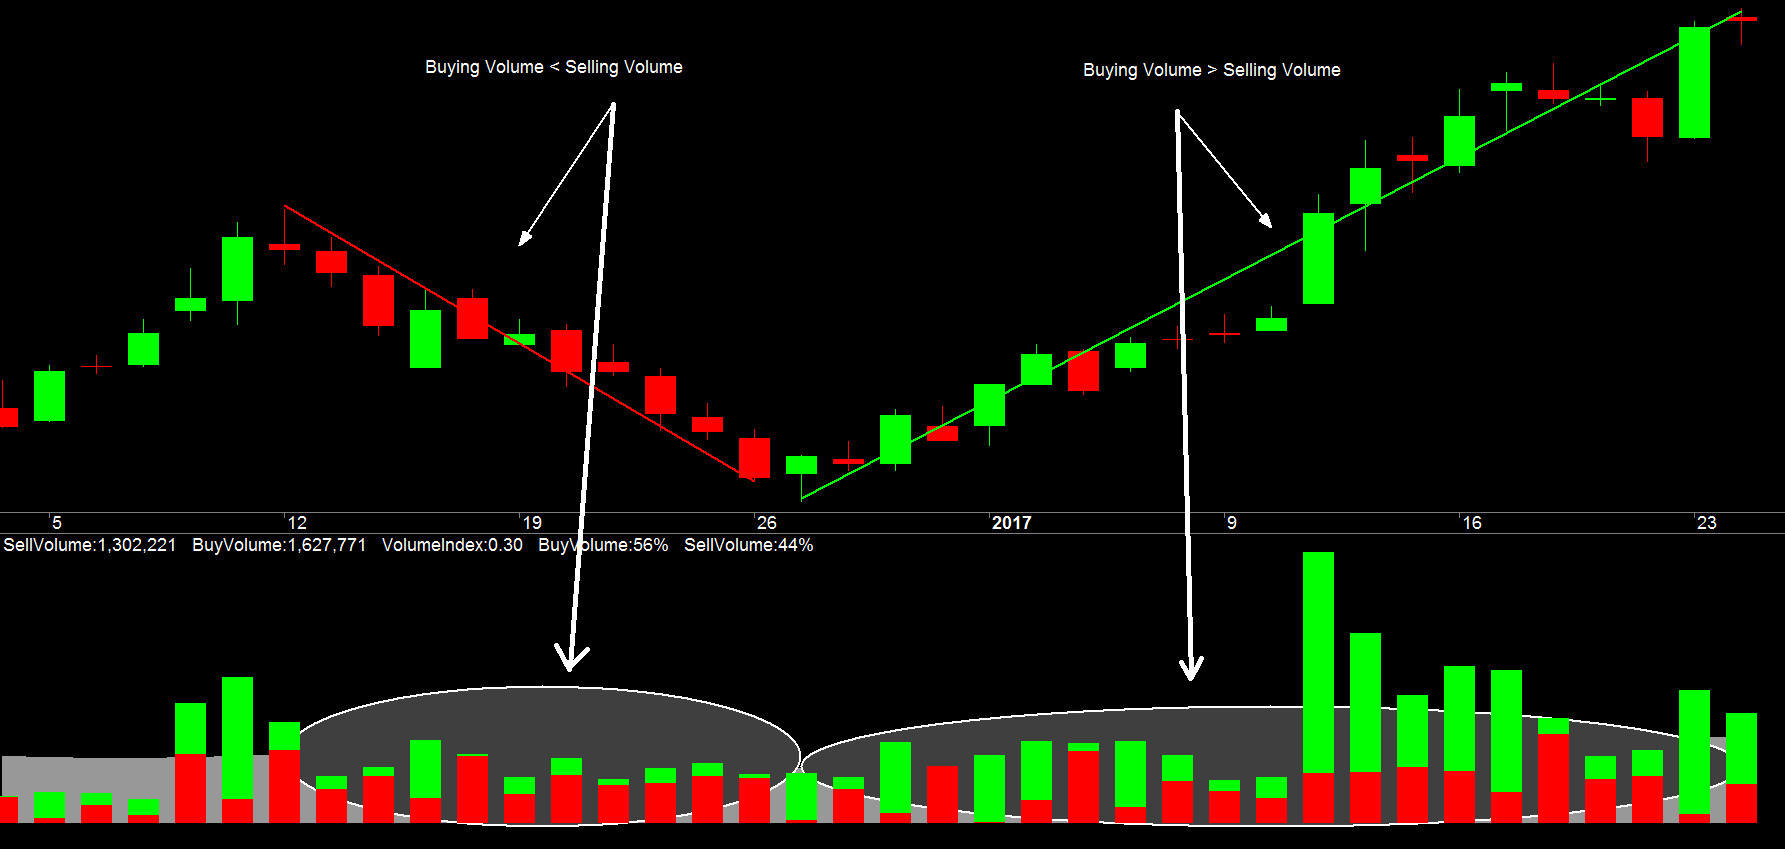
The same buying volume selling volume indicator is shown in the featured image at the start. The buying volume selling volume indicator is used as histogram chart. When we do not consider the color of the individual bar it also serve at a routine volume indicator. But the real meaning of the bar lies in the color. The comparative size of green color indicates buying of smart money and red color indicates selling of smart money.
How To Use Buying Volume Selling Volume Indicator?
This indicator is an aid for chart readers. Means it is useful for improvement in your judgment of reading chart bar by bar. This indicator can not be used strictly as a trading system directly. Still, we can prepare a trading system based on it. But for now, we will learn to use it as a judgment tool.

The best way is to look for change. As seen in the above chart, when the price was going down the individual bars of BVSV indicator had greater selling than buying. That is indicated by more red color in the bars than the green color. When the price was going up the individual bars on BVSV indicator had greater buying than selling. The same is indicated by more green color in the bars than red color.
The beauty of BVSV indicator is that it tells right on each and every bar whether the buying was dominant or selling was dominant. The bar can be of any timeframe from 5-min to daily. So we can use this indicator for intraday trading, swing trading, position trading with any timeframe charts. So we can judge the action of smart money right on the individual bar even in intraday or end of day charts.
BVSV Indicator As Indication Of Change In Price Direction And Volume Index:
As seen in the above chart, the smart money is selling on bars with dominated red colors. But right on the price bar containing the swing low, the smart money changed their activity from selling to buying. So right on that bar, the price started rising with the sustained buying volume. The buying continued on the coming bars and also with increase volume activity. That suggest that smart money is actively buying the stock.
So this way we can find the intention of smart money right on each and every bar. So we can follow their activity right from the start of the move. The BVSV indicator also gives us comparative volume index. Thus we can compare the trading volume on the particular bar with respect to average trading volume. If the VI is less than 1 it indicates less volume and absence of interest of smart money. If the VI is greater than 1 then it indicates higher volume and active interest of smart money on that bar. Thus the Volume Index VI help us decide the presence or absence of interest of smart money.
To Download The BVSV Indicator Click Here
Do Watch video presentation below on how to use BVSV Smart Money Indicator In Intraday Trading And Swing Trading with detailed instruction with trading examples.


hello there, i loved the BVSV indicator. is there anybody how can help me please to buy or install this indicator, and how it works on desktop, i am a bignner, please,thank you.
Do you use Amibroker software? If yes you can download the indicator from :https://nascenttraders.com/download-trading-strategy-code/
You have to login with e-mail id for opening the page.
And if you are not familiar with Amibroker please take a look at my videos explaining it:
Pingback: find more information
I think other website proprietors should take this site as an model, very clean and great user genial style and design, let alone the content. You’re an expert in this topic!
I appreciate you sharing this blog article. Cool.
Thanks for Posting This, Kindly Keep Updating.
Hi Rakesh
I liked your youtube videos on floor pivot trading and BVSV indicator. Both are key elements. I dont have ambibroker as of now and i trade only liquid commodities(nat gas crude gold n silver) Wanted to know if BVSV can be used intraday via ambibroker. If yes, can i request u 2 post a video for the same which will demonstrate BVSV indicator usage for commodity intraday trading. Thanks in advance
Rgds
Ashish
Awaiting reply
Heartiest appreciate….
Great work …and simple approach…
Can you send this like for your video for this indicator to learn more about your instructions
Sure I will publish it within 24-48 hours