
BVSV Smart Money Indicator
To know about how to use BVSV Smart Money Indicator click on this link first. Here Is The Amibroker Code For BVSV Smart Money Indicator. If you are not sure how to use it in Amibroker software please watch this video.
_SECTION_BEGIN("BVSV Smart Money Indicator");
SetBarsRequired(sbrAll,sbrAll);
BV = IIf( (H==L), 0, V*(C-L)/(H-L) );
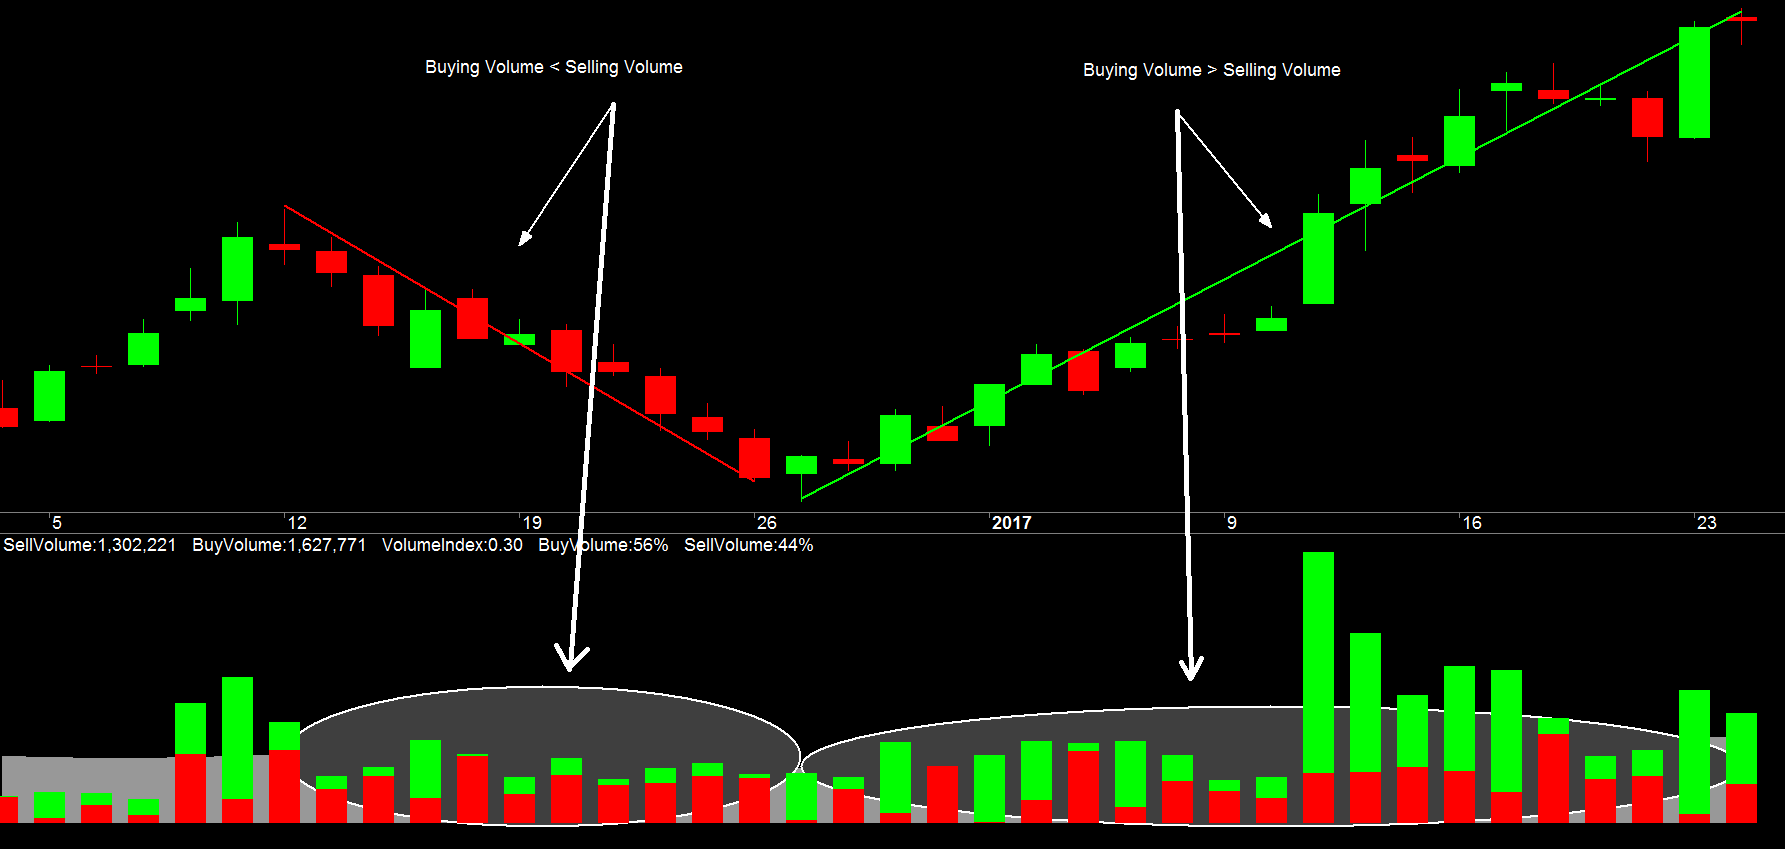
SV = IIf( (H==L), 0, V*(H-C)/(H-L) );
PlotOHLC(SV,SV,0,0,"SellVolume",colorRed,styleCandle|styleNoTitle|styleNoLabel );
PlotOHLC(SV,BV+SV,SV,BV+SV,"BuyVolume",colorbrightgreen ,styleCandle|styleNoTitle|styleNoLabel );
Va = MA(V,30);
PlotOHLC( Va, Va, 0, 0, "", ColorBlend( colorWhite , GetChartBkColor(), 0.4 ), styleNoLabel | styleCloud | styleNoRescale, Null, Null, Null, -1 );
Plot(Va,"Average Volume",colorRose,styleNoLine|styleNoLabel );
VI = V/Va;
Title = "SellVolume:"+WriteVal(SV,5.0)+" "+"BuyVolume:"+WriteVal(BV,5.0)+" "+"VolumeIndex:"+WriteVal(VI,1.2)+" "+
"BuyVolume:"+WriteVal(100*BV/(BV+SV),2.0)+"%"+" "+"SellVolume:"+WriteVal(100*SV/(BV+SV),2.0)+"%";
GfxSetOverlayMode(1);
GfxSelectFont("Verdana",12,800,True );
GfxSetBkMode(0);
GfxSetTextColor(ColorRGB(18,18,18));
GfxTextOut("Created By: Rakesh Solanki",800,130 );
GfxSelectFont("Verdana", 14, 800, True );
GfxSetBkMode(1);
GfxTextOut("www.nascenttraders.com",800,100 );
_SECTION_END();


I tried to plot Smart money indicator on Trading view. it shows me error. is there a way to plot
This indicator is only made for amibroker, you can’t apply in tradingview
dear rakeshbhai,
i’m new in stock market and learning since 1 year, can i talk with you for some knowledge
you can go to the contact page and send your query and also contact
Rakesh, is there a MT4 version of this?????
No its not available for MT4
hi
I am from viet nam
i need a code indicator to sum bvsv from n days (ex: 10 days, 20 days..)
plea help me, thanks
My Amibroker platform (5.2 professional edition) suggests an error at line 11 column 39.
The error script is the following: Error 31. Syntax error, expecting ) or ,
It refers to the following code line:
PlotOHLC( Va, Va, 0, 0, “”, ColorBlend ( colorWhite , GetChartBkColor(), 0.4 ), styleNoLabel | styleCloud | styleNoRescale, Null, Null, Null, -1 );
My cursor flags immediatly after the term ColorBlend.
I would like to know if someone of you has had the same kind of problem and how you have solved it.
Many thanks.
Kind regards,
Fredrick
I would suggest you try removing the last “, -1” part from the code from this line.
PlotOHLC( Va, Va, 0, 0, “”, ColorBlend ( colorWhite , GetChartBkColor(), 0.4 ), styleNoLabel | styleCloud | styleNoRescale, Null, Null, Null, -1 );
If it doesn’t work, use trial and error method and try to remove different code section in the formula.
Because I can’t do it because I don’t have any error from version 5.4 TO 6.7.
I would like to know if you have used this indicator with the version 4.8 of Amibroker and if it works.
I don’t have any version of Amibroker below 5.4, so I have not used this code in those versions.
_SECTION_BEGIN(“BVSV Smart Money Indicator”);
SetBarsRequired(sbrAll,sbrAll);
BV = IIf( (H==L), 0, V*(C-L)/(H-L) );
Warning 505. Division by zero. Divisor array at [0] is equal zero
SV = IIf( (H==L), 0, V*(H-C)/(H-L) );
Warning 505. Division by zero. Divisor array at [0] is equal zero
PlotOHLC(SV,SV,0,0,”SellVolume”,colorRed,styleCandle|styleNoTitle|styleNoLabel );
PlotOHLC(SV,BV+SV,SV,BV+SV,”BuyVolume”,colorbrightgreen ,styleCandle|styleNoTitle|styleNoLabel );
Va = MA(V,30);
PlotOHLC( Va, Va, 0, 0, “”, ColorBlend( colorWhite , GetChartBkColor(), 0.4 ), styleNoLabel | styleCloud | styleNoRescale, Null, Null, Null, -1 );
Plot(Va,”Average Volume”,colorRose,styleNoLine|styleNoLabel );
VI = V/Va;
Title = “SellVolume:”+WriteVal(SV,5.0)+” “+”BuyVolume:”+WriteVal(BV,5.0)+” “+”VolumeIndex:”+WriteVal(VI,1.2)+” “+
“BuyVolume:”+WriteVal(100*BV/(BV+SV),2.0)+”%”+”
Warning 505. Division by zero. Divisor array at [0] is equal zero
“+”SellVolume:”+WriteVal(100*SV/(BV+SV),2.0)+”%”;GfxSetOverlayMode(1);
GfxSelectFont(“Verdana”,12,800,True );
GfxSetBkMode(0);
GfxSetTextColor(ColorRGB(18,18,18));
GfxTextOut(“Created By: Rakesh Solanki”,800,130 );
GfxSelectFont(“Verdana”, 14, 800, True );
GfxSetBkMode(1);
GfxTextOut(“www.nascenttraders.com”,800,100 );
_SECTION_END();
warning code 505 is showing in this code. The error happens in the line above the warning “Warning 505. Division by zero. Divisor array at [0] is equal zero” I dont know afl but i think one has to replace 0 with null for this code to not show error. pl fix it
Thanks so much for the article. Really Cool.
Thank you for sharing your info. Certainly a lot of details to take into consideration. I will bookmark this page. You have a lot of knowledge on this topic.
Sir,
I am using Amibroker 4.8 professional edition. Getting below error
GfxTextOut(“Created By: Rakesh Solanki”,800,130 );
GfxSelectFont(“Verdana”, 14, 800, True );
GfxSetBkMode(1);
GfxTextOut(
Error 30 syntax error
However, I see that the same indicator works fine with Amibroker 5.9 standard edition (32 bit). Am I missing something? I want to use Amibroker 4.8 professional edition
Pretty nice post. I simply stumbled upon your blog and wished to say that I have really loved surfing around your weblog posts.
Pingback: Best Technical Indicator For Intraday Trading: Smart Money Buying Volume Selling Volume Indicator
Sir, I have copy paste the AFL of BVSV. in the amibroker, but the histogram bars are not coming, what may be the problem.My amibroker version is 5.70.
thank you…
What is the error showing please write as it is.
Sir what magical trendindicator
Sorry, Nitesh I can’t understand what you said.