
Basic Of Technical Analysis-History And Concepts
What is Technical Analysis?
In one sentence Technical Analysis is:
“Method of forecasting future price based on present and past prices with reasonable efficiency.”(And if someone is not doing it with the reasonable efficiency he is doing something else!)
Why Technical Analysis?
Because Financial Markets transactions involve humans, and humans behavior has repetitive patterns under extreme circumstances. These repetitive behaviors are recorded in the financial transactions in the market and by studying and analyzing it one can forecast the future direction of price.
The most important of all, technical analysis is equally useful to any time frame of trading including high frequency, intraday, swing, positional, long-term investments etc.
On surface a beginner of technical analysis would feel it like superstitious but when one dives into the deep of technical analysis they often found it miraculous, scientific and reliable.
Technical analysis requires very few data compared to fundamental analysis such as price and volume at various points. And if it is for the ultra-short term then it requires bid-ask price and quantity data from the order book.
Prediction of Stock Price
There are many varieties of market participants including Institutional investors, fund managers, insiders, market makers, specialists, professional traders, speculators, retail traders, retail investors etc. And they may be following many different approaches in their analysis of future price prediction. Also, there are many events happening all the time like economics events, events affecting the specific industry, events affecting the fundamentals of companies, news, rumors, tips, recommendations and much more. The results of all of these are available only in one variable that is the stock price, that is why many times stock price movement seems random and unpredictable.
It is impossible to correctly predict all these factors affecting the stock price and ultimately predicting stock price, and even if you correctly predict all of this factors you have to ahead of market professionals to benefit from predicted price movement. So technical analysis only uses the price of stock as its basic variable for predicting future price move.
History Of Technical Analysis
Charles Dow (1851-1902)
Technical Analysis is as old as the trading markets in the world, but its  organized study started in late 18th century by Charles Dow. He was American Journalist and founded world’s first market Index which is Dow Jones Industrial Average. He also founded the Dow theory for market analysis which later became the groundwork for Technical Analysis. Later many other independent types of research were done and all that added various concepts to the subject of technical analysis.

Richard D. Wyckoff (1873-1934)
Richard D. Wyckoff was the founder of “Magazine of Wall Street”, editor of “Stock Market Technique” and many other books and a stock market trader. He introduced the concept of accumulation, distribution, markup and markdown. He devised these concepts by the research of method of great traders of the time including Jesse Livermore, E.H. Harriman, James R. Keene, J.P.Morgan and many more. He also emphasized the importance of volume of trading combined with price movement.
R.N. Elliott (1871-1948)
R.N.Elliott was an accountant in America. He founded the “Elliott Wave Theory ” through his research of many years of stock market data. In his book “The Wave Principle” he stated that while stock market prices may appear random and unpredictable, they actually follow predictable, natural laws and can be measured and forecast using Fibonacci numbers.
Richard W. Schabacker
Richard W. Schabacker was a financial editor in Forbes, through his pioneer research he developed the concept of technical analysis of Charles Dow. He developed the conventional concept of chart pattern in technical analysis. He published his first book “Stock Market Theory and Practice” in 1930. This book includes the concepts of chart patterns and updated the work in his second book “Technical Analysis and Stock Market Profits” in 1932 which is in the real sense the bible of Technical Analysis.
W. D. Gann(1878-1955)
He was trader and author of stock market analysis techniques, he described Gann angles in the stock market analysis in his book “My Basis of Forecasting Method” in 1935. He wrote numbers of books on stock market indicating numerous concepts out of which Gann angles, Square of 9, Hexagon, Circle of 360 are major popular concepts. Gann’s forecasting methods use geometry, astrology and mathematics. In the time he had accurately predicted many financial booms and panics in the stock market.
Major Concepts In Technical Analysis:
- Dow Theory
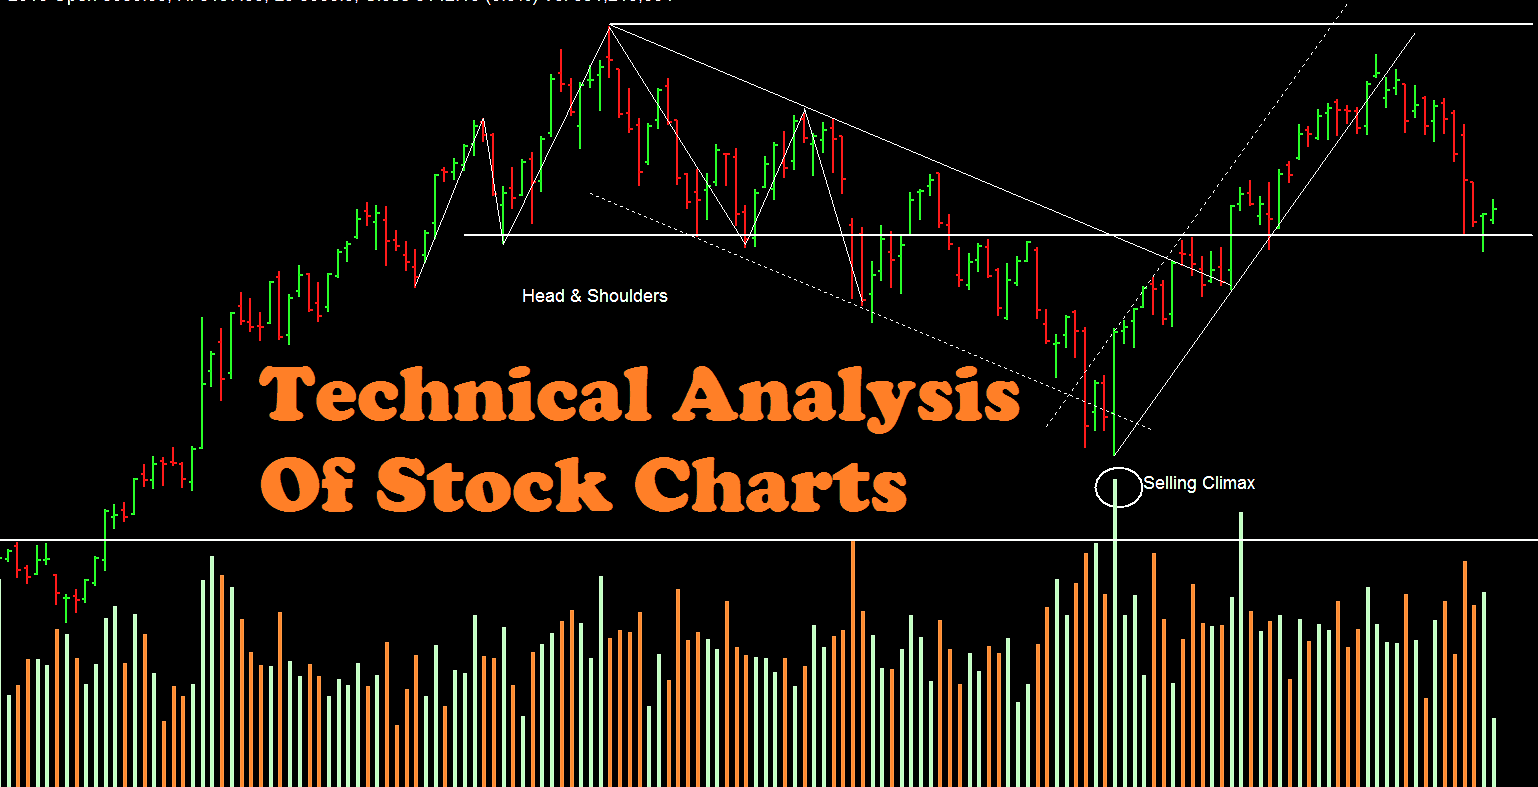
- Chart Pattern And Trend Line Analysis
- Mathematical Indicators Like Moving Averages, Trend Indicators And Oscillators
- Supply And Demand Using Price And Volume
- Elliott Wave Analysis
- Wyckoff Phase Analysis
- Gann Analysis
- Japanese Candlestick, Heikin Ashi And Ichimoku Chart Analysis
- Intraday Trading Techniques
- Complex Analysis


Hi there, I discovered your site by way of Google while searching for a
similar matter, your site came up, it seems to be great.
I have bookmarked it in my google bookmarks.
Hi there, just was aware of your weblog via Google,
and found that it is really informative. I am going to
be careful for brussels. I will be grateful
in the event you continue this in future.
Numerous other folks will be benefited out of your writing.
Cheers!